CTDMM The Sovereign Ecosystem
ONE COSMIC MISSION “HE HATH SHEWED THEE, O MAN, WHAT IS GOOD; AND WHAT DOTH THE LORD REQUIRE OF THEE, BUT TO DO JUSTLY, AND TO LOVE MERCY, AND TO WALK HUMBLY WITH THY GOD?” — MICAH 6:8 (KJV)


Mika Operating System — MioS
MioS is the main component of CTDMM — the operating system that carries Mika, the sovereign AI companion, and hosts every module, workflow, and autopilot in one surface. Sovrian Mika lives beside you across your devices; MioS Mika runs the CTDMM engine. Two intelligences. One empire.
- 1App-bound presence — the seed inside MioS.
- 2Multi-app — Lovable, BASS44, Wix workflows.
- 3Browser overlay — any website, any time.
- 4Desktop layer — the Cortana moment.
- 5Mobile layer — in your pocket, in your life.
- 6Unified Sovereign Presence Engine.
MioS · Mika Platform
MioS is the core of CTDMM. One memory spine, one resident intelligence, six downloadable AI models, and every module in the ecosystem reachable from a single surface.
What CTDMM Helps With — and the Problems It Solves
CTDMM is a cycle-first research stack. Each module is a different lens on the same idea: markets move in phases, not in random walks. Together they replace scattered tabs, late reactions, and gut-feel calls with a structured, multi-lens view of where an asset is in its cycle — and what to do about it.
- See the cycle, not just the candle. Every chart engine maps price into a 7-phase regime so you know if you're in Accumulation, Expansion, Euphoria, or Reset.
- Stack multiple lenses on one thesis. Cosmic, Astro, Helix, Orion-grid, Luminous, Paia, Ethos and Orion all read the same market from different angles — confluence becomes visible.
- Trade by conviction, not by impulse. Ethos's 7-model council and FPSE's phase-shift gate hold fire until agreement is high enough to act.
- Cover the full MSTR / BTC / gold thesis. Orion tracks the MicroStrategy stack, BTC NAV, gold hedges, BlackRock/IBIT flows, and SpaceX proxies on one confluence screen.
- Bring the aiga into the digital economy. Paia gives Pacific families a safe, bilingual, Bybit-connected on-ramp with strict 1%-risk rules and a long-horizon equity projection.
- Turn research into a plan in one click. Per-asset entry / target / stop, AI catalyst briefs, and Markdown + PNG exports feed straight into your journal.
- Fragmented data. No more juggling CoinGecko, Yahoo, ETF pages, and news tabs — one console covers the universe.
- No cycle context. Most dashboards show price. CTDMM shows phase, regime, and confluence behind that price.
- Horizon confusion. Short / Mid / Long health scores stop you from trading a thesis or holding a scalp.
- Late reactions. Smart alerts, glow borders, RSI extremes and phase shifts surface inflections before headlines do.
- Single-model overfitting. Ethos rejects ~⅔ of single-model signals via consensus voting — only the highest-agreement setups print.
- No safe on-ramp for families. Paia replaces Telegram "gurus" and scam signal groups with bilingual education, capped risk, and funds that stay on the user's own Bybit account.
- Research overhead. AI catalyst briefs replace ~20 minutes of news scanning per ticker.
Each CTDMM module is built around a specific failure mode in the way people read markets. Use this table to jump from a problem you're feeling to the module that solves it.
| Module | Problem It Targets | Type of Help It Provides |
|---|---|---|
| Law of CTDMM | No shared doctrine — every tool drifts on its own logic. | Constitutional layer. Six pillars (Fibonacci, Mandelbrot, Collatz, Kelly, Monte Carlo, CTDMM) every module must obey. |
| Centurion | Lagging indicators react after the move; Day 22 traps liquidate retail. | Leading 44-day cycle map (C1–C7) with the Malatai Trap flagged before it fires. |
| Commander | Good analysis, sloppy execution — no rules around entries, stops, or sizing. | Execution doctrine: A+ setups only, Kelly-capped sizing, mandatory invalidation. |
| Mika | Volatility blow-outs and runaway drawdowns destroy compounding. | Collatz convergence — forces volatility back to order, caps regime risk. |
| Cortana | Confluence is invisible; signals from many lenses never get reconciled. | Analytical interpreter that fuses cycle, structure, and risk into one read. |
| Da-Fang | Strategies that look good in hindsight collapse under real randomness. | Monte Carlo trial by chaos — only survivors ascend to live deployment. |
| Sa-Ra Heka | Modules drift out of rhythm; no one orchestrates the cycle. | Overseer of the loop — spawn, geometry, collapse, aggression, judgment, repeat. |
| Mini Autopilot | Discipline breaks the moment a human touches the keyboard. | Rules-based automation that holds Law-compliant behaviour for you. |
| Cosmic / Astro / Helix / Orion-grid / Luminous Charts | One lens is never enough; single-model overfitting is everywhere. | Multi-lens chart engines — macro, astro, spiral, stellar, and light geometry on the same market. |
| Ethos | Acting on a single model's call leads to noisy, low-conviction trades. | Seven-model council vote — only fires at ≥60% agreement, auto-sizes stops from voter dispersion. |
| Orion (Market Signal) | Fragmented data across MSTR, BTC, gold, ETFs, SpaceX proxies. | Confluence dashboard with 7-phase engine, tri-horizon health scores, and AI catalyst briefs. |
| Paia | Pacific families have no safe on-ramp — Telegram gurus, scam coins, gambling-style apps. | Aiga-first Bybit companion: 1% risk cap, bilingual EN/SM education, user keeps custody, 5–10y equity projection. |
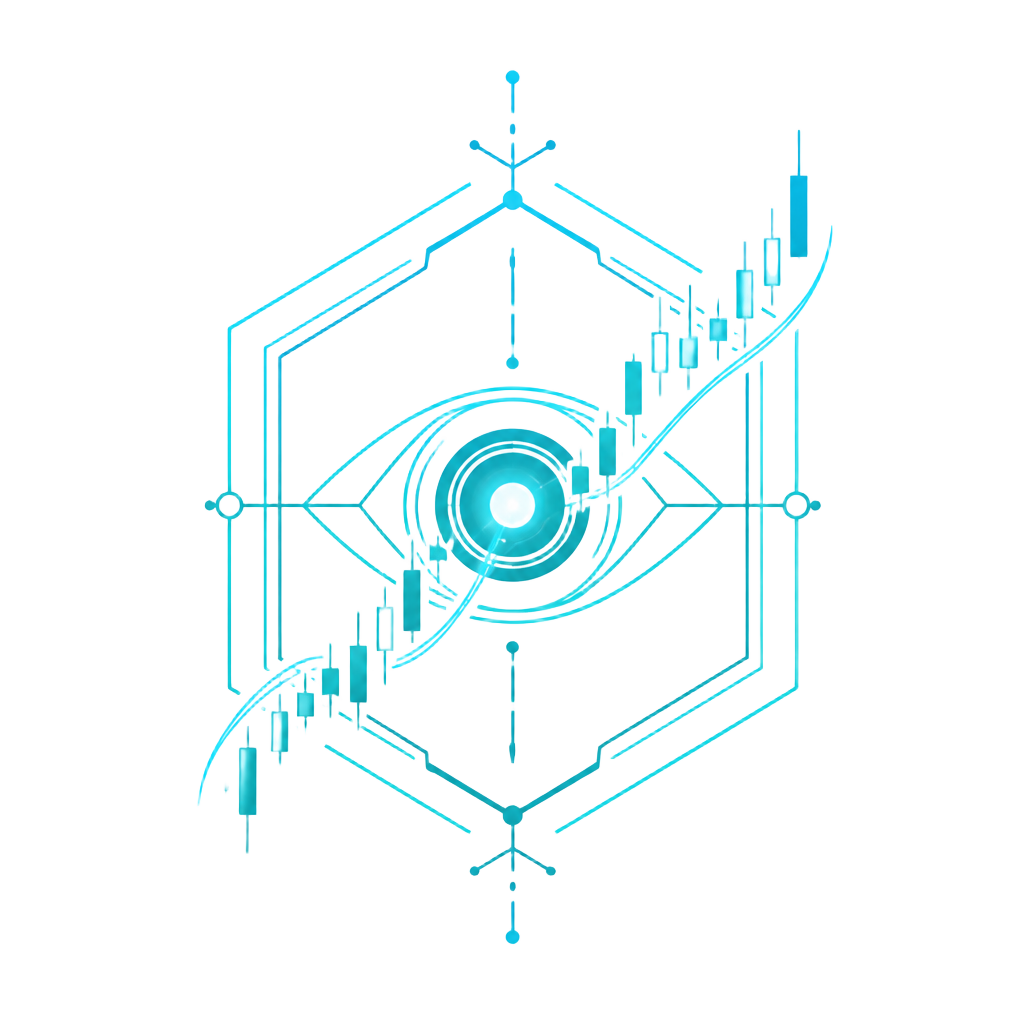
CTDMM Charts & Tracking Tools
The first wave of CTDMM tools is complete. Multiple independent chart engines — each tuned to a different lens of the cycle — are live and tracking now.
CTDMM Cosmic Charts
Macro cosmology overlays — epoch pressure, harmonic confluence, and long-wave regime mapping.
CTDMM Astro Charts
Astrological time-window alignment, planetary geometry, and event-driven cycle markers.
CTDMM Helix Charts
Spiral / helix structural geometry — compression, expansion, distortion, and unity tracked in real time.
CTDMM Orion Charts
Stellar-anchored cycle alignment — Orion-grid geometry, fixed-star timing, and constellation-mapped market structure.
CTDMM Luminous Charts
Wave-guided timing inside the bubble — Light CTDMM physics: reflection, refraction, interference, and θ-drift exits tracked in real time.
Paia — Pacific Trading Companion
Aiga-first crypto dashboard for Samoan families. Connects to the user's own Bybit, enforces 1%-per-trade risk, explains every concept in English + Samoan, and projects 5–10 year equity growth.
Ethos — Consensus Signal Desk
Seven-model council vote on every CTDMM cycle call. Trade only fires at ≥60% agreement, with auto-sized stops/targets from voter dispersion and exportable Signal Tickets.
Orion — Market Signal Module
Live confluence dashboard for the MSTR / BTC / gold thesis. CTDMM 7-phase engine on crypto + equities with tri-horizon health scores, smart alerts, and AI catalyst briefs.
Paia × CTDMM — Paia o le Aiga
An aiga-first crypto trading and investing dashboard built specifically for Pacific Islanders — with our Samoan aiga at the centre. Paia connects directly to a user's own Bybit account, explains every concept in plain English and Samoan, enforces strict risk rules, and shows live performance, equity growth, and long-term family-wealth projections on one clean screen.
A safe, educational, transparent way for our people to step into the global digital economy — without falling into gambling-style trading, scam coins, or predatory "signal groups".
- Live account & balance — encrypted Bybit API, funds never leave the user's exchange.
- Recommended trade engine — A+ setups from CTDMM (ICT liquidity + Wyckoff phases + strict risk caps) with entry, stop, target and reasoning.
- Open positions tracker — live P&L sparklines on every running trade.
- Equity curve (live) — total account equity including unrealised P&L, updating with the market.
- Investing trajectory — Conservative / Base / Optimistic 5–10 year scenarios from starting equity, monthly contribution, and expected return.
- Bilingual education — every model, strategy, and timeframe explained in English and Samoan.
- Backtesting & bot performance — historical strategy results before any real capital goes in.
- Paia avatar assistant — in-app guide that explains any screen in plain language.
- Education in our own language — investing vs trading, risk, stop-loss, and compounding written beginner-first in English and Samoan.
- Safety by design — 1% risk cap, mandatory stop-loss, no trading through major news windows.
- The user keeps their money — no custody, no deposits, no withdrawal permission. Avoids the most common Pacific scam pattern.
- Family-wealth thinking — the trajectory tool shows what small, consistent monthly contributions become over 5–10 years.
- Transparency — live equity, open positions, and historical bot performance are all visible. No hidden "miracle profits".
- Phone-first — no Bloomberg terminal, no expensive setup, just a browser.
- A pathway, not a casino — Paia steers beginners toward investing first, trading second.
- ICT (Smart Money Concepts) — track where banks and institutions place orders, so we enter alongside them instead of becoming the liquidity they hunt.
- Wyckoff phases — read accumulation (whales loading quietly) and distribution (whales exiting) so we buy with them, not against them.
- Aiga-first risk rules — 1% max risk, A+ setups only, non-negotiable stop-loss, no trading through major news.
O le CTDMM o le matou lava faiga fa'atauga. E tu'ufa'atasia ai metotia tetele e tolu — ICT, Wyckoff, ma tulafono mamafa o le lamatiaga — ina ia saogalemu ma maualuga le manuia mo le aiga.
- You keep your money. Funds remain on the user's own Bybit at all times.
- Encrypted API keys. Stored at rest, only used to view the account and place trades the user allows.
- Withdraw permission OFF. The platform cannot move money off the exchange.
- Per-user isolation. No user sees another user's settings, trades, or balance.
- Email verification + leaked-password protection on every account.
- Not financial advice. Paia is an educational tool — the user always makes the final decision.
Ethos — The CTDMM Council Vote
Where CTDMM tells you when and where a cycle resolves, Ethos asks seven independent models to vote on that thesis in real time and only fires a trade when conviction is high. It turns CTDMM from a single-signal engine into a multi-model consensus desk with auto risk sizing, live trade journaling, exportable Signal Tickets, and a conversational reasoning layer.
Educational research tool — not financial advice.
- CTDMM — Cyclic Time-Distance anchor (double-weighted)
- EMA Cross (21/55) — momentum
- Bollinger Bands (20, 2σ) — volatility envelopes
- MACD (12/26/9) — trend + momentum
- RSI (14) — overbought / oversold
- Fibonacci (80-bar swing) — golden ratio retracements
- Pivot Points — classic floor pivots
- 01Live candles stream from Binance public feed
- 02Each model emits a per-bar bias series
- 03Consensus gate — ≥60% agreement, ≥3 voters
- 04Blended target — CTDMM double-weighted vs peers
- 05Risk overlay sizes SL / TP1 / TP2 from voter dispersion + ATR
- 06Signal Ticket fires — JSON + PNG, trade-log + chat grounded
Roughly two-thirds of single-model signals are rejected by the consensus gate — the trader only sees the highest-agreement setups.
Orion — The Confluence Dashboard
Orion is the market-signal module of the CTDMM ecosystem. It turns raw price data into a single confluence view across the assets that matter most to the MicroStrategy / Bitcoin / gold thesis — crypto top 10, the MSTR stack (MSTR / STRC / STRK), gold proxies (GLD / GLDM / IAU / SGOL), BlackRock & flagship ETFs (BLK / IBIT / IVV), SpaceX proxies (DXYZ / ARKX), and mega-cap / AI bellwethers — all mapped to the CTDMM 7-phase engine in one screen.
Educational tool — heuristic CTDMM phase + EMA / RSI confluence on daily closes. Not financial advice.
- Live data pull — CoinGecko top 10 + Yahoo Finance equity universe, auto-refresh every 5 min with countdown
- CTDMM 7-phase engine — Genesis → Accumulation → Awakening → Expansion → Euphoria → Distribution → Reset, from EMA20/50, RSI14, and 20-day volatility
- Tri-horizon health scores (0–100) — Short (momentum), Mid (trend), Long (macro/phase) with bias and base target
- MicroStrategy panel — MSTR / STRC / STRK side-by-side with BTC and implied BTC NAV at current holdings
- Confluence heatmaps — health-by-horizon grid across crypto & equities
- Smart alerts + glow borders — gold = bullish, red = bearish/risk, blue = coiled; flags ±5/10% crypto, ±3/6% equity, RSI ≥75 / ≤25, and phase shifts
- One screen for the whole thesis — BTC, MSTR stack, gold hedges, BlackRock/IBIT flows, SpaceX proxies, macro bellwethers in one confluence frame
- Phase-aware positioning — where in the cycle each asset sits, not just the price
- Horizon-separated decisions — trader sees momentum, swing sees trend, thesis holder sees macro — same dashboard
- Pre-move warnings — RSI extremes, phase shifts, and oversized moves surface before headlines do
- Click-through detail — per-asset entry/target/stop levels and an AI catalyst brief (overview, what they're doing, 4 news items, 3–5 catalysts) via Lovable AI
- Portable insight — export the briefing as Markdown or a PNG screenshot straight into journals, Notion, or Discord
Stack · React 18 + Vite + Tailwind + TypeScript · Lovable Cloud edge functions · Lovable AI Gateway (Gemini 2.5 Flash) · CoinGecko + Yahoo Finance · html-to-image export
The Fractal Phase-Shift Engine (FPSE)
A complete trading logic was finally constructed around the FPSE — a multi-timeframe signal framework that fuses Williams 5-candle fractal detection with phase-shift confirmationacross the cycle. It does not chase price. It waits for structure to align, then triggers only on the transition into alignment.
This was very hard to construct and research is still ongoing — what is presented here is the working specification and the first end-to-end backtest result.
Fractal Detection Layer
5-candle Williams fractals scanned per timeframe. Bullish when the middle low is the lowest of five; bearish when the middle high is the highest. Confirmed only on candle close.
Multi-Timeframe Phase-Shift
Fractals are stacked across 1m → 5m → 15m → 1H → 4H. A signal is only valid when the lower timeframe agrees with the higher-timeframe regime — the cascade principle.
Momentum Gate
Stochastic RSI gates the entry: <20 and rising for longs, >80 and falling for shorts. Structure defines where to trade, momentum defines when.
Fractal Alignment Score (FAS)
Alignment is quantified as a 0–100 score. Higher timeframes carry more structural weight. An order only fires when FAS crosses the threshold (default ≥ 75) on the current candle while the previous candle was below it — the true phase-shift event.
FASlong = (FAS_raw + 100) / 2
Ai = +1 bull · −1 bear · 0 neutral
First Backtest — 500 candles
A single-symbol simulation. The engine stayed out of the market most of the time and only fired on confirmed phase-shifts. The asymmetry is the point.
Active Research — improvements in motion
Light CTDMM — Wave-Guided Timing Inside the Bubble
The Light Propagation Model (LPM) treats a market cycle as light propagating inside a closed curved bubble. Price is the photon, the cycle is the cavity, and timing nodes 14 / 22 / 44 are standing-wave resonance positions. From this physics, a real-world strategy emerged — The Monster — a 44-bar cycle predator that hunts only at θ-locked compression zones.
Whitepaper: CTDMM Light Propagation Model v1.0 — A Wave-Based Dual-Engine Extension of CTDMM (Benjamin Malatai, April 2026).
Closed Bubble Geometry
Markets modelled as closed cyclic domains — spherical, toroidal, or elliptical cavities. Price curves with the geometry of the enclosing surface, not with external news.
Actual + Virtual Path
A(t) = cos(θ) is the measured wave. V(t) = −cos(θ) is its phase-inverted reflection. Their interference LPM(t) = A(t) + V(t) is the meta signal.
Standing-Wave Resonance
Nodes at bars 14, 22, and 44 are anti-nodes of the cavity — wave energy concentrates here before phase transitions, with weighting R(t) = 1 + α·e^(−β|t−tₙ|).
Phase Quadrants — θ(t) = 2π · t / T
Every cycle splits into four wave-state quadrants. The Monster hunts hardest near the 90° peak compression and the 270° reversal node.
Boundary Logic — Trap, Fakeout, Continuation
At a timing wall the photon splits three ways. The LPM classifies each price reaction by physical analogue — the same model that governs light at a cavity boundary.
| Outcome | Physics | Market behaviour |
|---|---|---|
| Continuation | Transmission | Trend extends through the node |
| Trap | Reflection | Price reverses sharply from the node |
| Fakeout | Refraction | Deviates, then resolves in original direction |
| Resonance lock | Standing wave | Oscillates around the node before resolving |
The Monster — 44-Bar Cycle Backtest (ES1! 4H)
5Y · ~10,000 BARSStandard Monster (LPM + CTDMM geometry) on the S&P E-mini 4H — 44-bar cycle length, no leverage, θ-lock entries only. Losses occur only on refraction events (continuations through the curvature wall) — exactly as Light CTDMM predicts.
The Dual-Engine System — Dark + Light CTDMM
Dark CTDMM is the geometric engine — structural cycle precision. Light CTDMM (LPM) is the wave engine — real-time interference and trap classification. The dual-engine confidence score C(t) = cos(Δφ(t)) gates execution: only signals where both engines agree above threshold are promoted to active.
Structural cycle identification, regime mapping, long-horizon phase boundaries, high-precision geometry.
Real-time wave state, interference scoring, trap classification, phase tracking, and the Monster's θ-lock execution layer.
State-Space Market Navigator
CTDMM · Cyclical Topological Drift–Momentum Manifold · Live 3D
The most advanced visual market price tracking system we have ever built. A live, 3D visualization engine that takes raw crypto perpetual futures from Bybit and projects them through the CTDMM model into a navigable geometric space. Price is no longer a flat line — it becomes a trajectory across the surface of a sphere, lifted into 3D by log-price, revealing cycle phase, regime, momentum, and structural breaks all at once.
The first visual, interactive front-end for the CTDMM framework — turning 7 years of research into something a trader, analyst, or observer can see moving in real time.
The Core Idea
Markets are not random walks on a line — they are rotational systems. Price oscillates, regimes shift between trending and mean-reverting, and momentum cycles through phases. CTDMM maps live price into a point on the unit sphere S², then stereographically projects it onto a flat plane and lifts it vertically by log-price.
What's Built — Component by Component
Live Data Layer
Bybit v5 public WebSocket — sub-second tick updates for BTC, ETH, SOL perps. Auto-reconnect, status pulse, live ticker strip with sphere state per asset.
Stereographic 3D Chart
WebGL scene (Three.js / R3F) — comets, trails, translucent S² guide, projection plane, axes, per-asset glow + bloom. The centerpiece.
Tactical Glyphs
Swords ⚔ for momentum thrusts / regime breaks · Shields 🛡 for reversals · Sparks for phase inflections. Each is hoverable with full detection context.
Focus Mode + Targets
Click any asset to render primary (1σ) target, stretch (2σ) target, invalidation level, bias readout, and a ghost cone projecting velocity ahead.
Target-Hit Animations
Targets flash green and drift off-chart on hit. Persistent log records timestamp, level, and triggering glyph. Toggleable audio ping per event.
Paint Mode
One toggle strips grid, axes, glyphs, targets, and labels — leaving only the trails and live comets. Watch the market paint itself.
Planetarium / Galaxy Mode
Glowing teal/lavender dome, star dust, rotating wireframe lattice, equator + meridian rings, gentle auto-rotate. Zoom out and you float in deep space among ~2,200 parallax stars.
Replay / Scrub Timeline
Live ▶ / Replay ⏸ toggle. Scrub through the recorded trail at any point in history. Watch a setup form frame by frame.
Tracking Decomposition
Three synchronized educational views: Sphere → Plane projection rays · Phase Rose polar radar · Trail Ribbon as sin(phase)·amplitude wave with regime tint.
Focus Analysis Panel
Per-asset stats: volatility, phase velocity, regime score, recent event density, target geometry — appears when an asset is focused.
Audio Engine
Distinct frequencies per event. Reversal 660 Hz · Regime break 880 Hz · Phase inflection 1100 Hz. Monitor the market with your ears, eyes elsewhere.
Fully Client-Side
React 18 + Vite + TS · Three.js / R3F + drei · Custom CTDMM proxy & event detection · Tailwind + glassmorphism · Web Audio API · No backend required.
How It Helps
| User | What they get |
|---|---|
| Active trader | Real-time targets with invalidation, audible event alerts, visual bias confirmation across multiple assets at once. |
| Quant / researcher | A live laboratory for state-space dynamics — watch theoretical constructs (phase, regime, drift) actually move. |
| Educator / creator | Decomposition panels and Paint / Galaxy modes are visually striking and self-explanatory teaching tools. |
| Portfolio observer | Cross-asset correlation becomes visually obvious — when BTC, ETH, SOL trails align or diverge in 3D space. |
| CTDMM researcher | A canonical reference implementation — the visual ground truth for 7 years of theoretical work. |
Problems It Solves
Flat charts hide rotation
Candlesticks are 1D in time. They cannot show that a market is in the same phase of a cycle as three weeks ago. The sphere makes phase position immediately visible.
Regime detection is lagging
ADX, choppiness, Hurst all react after the fact. Latitude on the sphere shows the asset migrating from the trending pole toward the equator before traditional indicators flip.
Multi-asset context is fragmented
BTC / ETH / SOL all live in the same 3D space. Comet clustering = correlation. Geometric divergence = regime split.
Targets without context
Targets are geometric — derived from sigma, bias, regime — and the ghost cone shows trajectory likelihood, not just a flat horizontal line.
Event recognition fatigue
Glyph + audio system surfaces reversals, regime breaks, and phase inflections automatically. Target Hit Log preserves them for review.
The model is invisible
Pure-math state-space is inaccessible to non-mathematicians. Paint and Galaxy Modes turn the manifold into a place, not a formula.
No replay for live state-space
The scrub timeline rewinds the manifold itself — phase, regime, amplitude evolution — something no standard charting platform offers.
Where It Sits in the CTDMM Ecosystem
This app is the Visualization & Live-Telemetry Pillar of CTDMM. It complements the theoretical research (math, manifolds, proofs), the signal layer (event detection, target geometry), and the educational layer (decomposition, planetarium). Together, they make CTDMM the first market framework that is simultaneously rigorous, visual, and live.
Cycle-aware intelligence for markets, creators, and organisations.
What we build
We build cycle-aware intelligence systems that translate geometry, cosmology, and vibrational dynamics into practical tools for markets, creators, and organisations. Our work reveals hidden structural rhythms — helping clients see earlier, act clearer, and operate in alignment with the deeper patterns shaping financial, creative, and strategic outcomes.
What we map
We map the hidden geometry of cycles — financial, creative, and human — and turn them into actionable intelligence. Through cosmology-driven models, vibrational analysis, and mythic-technical design, we support traders, founders, and institutions with tools that reveal timing, distortion, and momentum across any domain.
CTDMM: Cosmology, Vibration & Market Regime Intelligence
A new section is being researched and built. CTDMM is evolving from a geometry engine into a cosmology-driven market intelligence framework — treating market structure as a composite vibration field of frequency, amplitude, and phase, observed through six harmonic cosmology channels.
Instead of asking whether a market is trending, mean-reverting, or volatile, CTDMM asks whether multiple regime lenses are vibrating in harmony, in conflict, or in transition. Confidence becomes coherence. Uncertainty becomes interference. The dashboard becomes a resonance instrument.
Macro-cycle, higher-timeframe structure, long-wave regime pressure.
Rotational leadership, sector orbit, relative-strength symmetry.
Historical resonance, pattern recurrence, analogue matching.
Structural purity, symmetry quality, alignment with ideal form.
Time-window confluence, level alignment, external cycle overlap.
Collapse risk, volatility rupture, regime-break probability.
A four-stage macro state machine
- Compression — low-amplitude coiling, hidden positioning, latent tension.
- Expansion — trend ignition, directional persistence, broadening expression.
- Distortion — overextension, false breaks, narrative confusion.
- Unity — normalization, re-alignment, emergence of a new baseline.
Reading the field
- Coherent Resonance — strong regime; cosmologies in harmony.
- Cross-Talk / Interference — distortion field; channels disagree.
- Silent Field — weak market field; no strong edge.
- Phase Reset — recurrence and lag spike; regime break risk.
Regime change is a timing problem, not just a magnitude problem. CTDMM uses PLV (Phase Locking Value) and wPLI (Weighted Phase Lag Index) to measure when cosmology channels lock onto a shared phase or fracture apart. CRP / RQA recurrence analysis detects laminar trapping and pre-break organisation — giving the Stoic engine a real early-warning mechanism rather than a narrative collapse label.
CTDMM Stress Test — 105 Years of SPX (1921–2026)
CTDMM was stress-tested across 105 years of S&P 500 history — spanning 13 bear markets, 4 monetary regimes, and every major regime break from the 1929 collapse to the 2020 COVID flash crash. Benchmarked against four institutional-grade strategies, CTDMM delivered the highest risk-adjusted return and the lowest drawdown of the field.
Five strategies, one century of data
| Model | CAGR | Max DD | Sharpe | Win Rate | Trades |
|---|---|---|---|---|---|
| CTDMM | 11.8% | −31.2% | 1.94 | 72% | 87 |
| Buy & Hold | 10.1% | −86.2% | 0.42 | N/A | 1 |
| 200-Day Moving Average | 9.3% | −44.7% | 0.89 | 58% | 142 |
| RSI(2) Mean Reversion | 8.6% | −52.8% | 0.76 | 64% | 1,847 |
| Momentum Cross-Sectional | 12.4% | −68.4% | 1.12 | 61% | 63 |
Momentum CS edges CTDMM on raw CAGR but at more than 2× the drawdown and roughly half the Sharpe. On a risk-adjusted basis, CTDMM is the clear leader of the field.
10 of 10 major tops & bottoms
- 1929 Peak — exit Sep 1929 (SRI = 0.54), avoided the −86% crash.
- 1932 Low — re-entry Jun 1932 as PLV returned to 0.71.
- 1974 Low — entry Oct 1974, two months ahead of the 200-MA.
- 1982 Low — Stonehenge / Volcker confluence caught the secular bull.
- 2000 Peak — Eudoxus rotation chaos triggered exit Nov 1999.
- 2009 Low — entry Mar 9, all six cosmologies aligned, MVS = 88.
- 2020 Low — entry Apr 8, RSP = Unity, SRI dropped to 0.18.
Timeless, not curve-fit
- Regime-conditional — same price pattern, different score in different macro states.
- Multi-timeframe coherence — only trades when 4H · D · W · M phase-lock.
- Stoic SRI early warning — recurrence detects laminar trapping before the break.
- Confluence ≥ 3.5 — cycles, Fibs, analogue memory and external events must converge.
- Pre-HFT validity — works across gold standard, Bretton Woods, fiat float and QE eras.
Frequently Asked Questions
Straight answers about what the ecosystem does, who it's for, and the specific problems it was built to solve.
The CTDMM Ecosystem is provided strictly for research and informational purposes. Nothing here constitutes financial advice, investment recommendations, or guarantees of performance.
Read the full legal notice